


Motors and Motoring
Taxation and the Use of Motor Vehicles. British Motor -Prices TAXATION is in the minds of many people at the present time,
in consequence of this sales have been stimulated over a
country. America, which has long since become -the home of the motor, was wise in realizing early that turnover rather than a high tax per unit was the policy at which to aim, and
and below I am giving some information concerning motor levies which shows well how highly we are taxed in this course of years to an extent which has brought almost un- believable prosperity not only to the motor industry of the United States but to the country as a whole. By making motoring comparatively inexpensive phenomenal expansion has been given to bank deposits, building and loan invest- ments, life insurance, and so on. Here we rather tend to stifle registration of vehicles, particularly used vehicles, by the adoption and retention of a high rate of tax. The table of motor taxation receipts for the years 1921-1927 shows that while the average tax per vehicle on private cars and motor cycles decreased, that on commercial vehicles and hackneys increased. It is significant that the greatest increase in total receipts has been for the category of private cars where the average tax per vehicle is lower by comparison and declining, while the smallest increase in total receipts has been in the -hackney group where the average tax is high and increasing. Below is a comparison of the average tax per type of vehicle in Great Britain with that of other important motor using countries, and the current annual taxation converted to sterling at the current rate of exchange is given for three typical motor vehicles, a 20 h.p. private car model, a 4 ton lorry, and a 82 seated omnibus. The Society of Motor Manufacturers and Traders here now collect much useful data in the year which are not only- of use to the industry but are of interest to the motoring public. The figures in this article have been supplied to me by the Society.
.
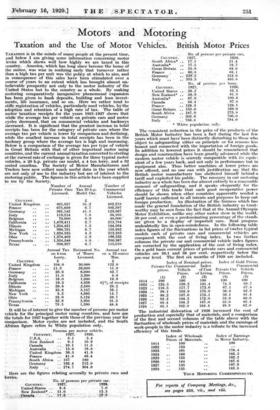
COUNTRY.
Number of Private Cars Licensed.
Annual Tax-20-h.p. Model Car.
Number of Commercial Vehicles Licensed.
United Kingdom .. 801,857 31.3 402,218 France .. .. 671,059 6.7 305,587 Germany ..
261,142 41.1 123,567 Italy .. .. 119,214 7.8 34,105 Belgium .. .. 70,000 6.9 40,000 California .. 1,479,411 2.7 213,784 Illinois .. .. 1,254,421 1.5 184,564 Michigan .. .. 998,781 6.7 155,982 New York .. .. 1,624,535 4.3 313,383 Ohio .. • . 1,374,402 2.9 196,332 Pennsylvania .. 1,354,548 . 4.8 200,367 Texas .. .. 996,397 6.7 115,010
COUNTRY.
Annual Tax on 4-ton Lorry. £ Estimated No. Annual tax of 'Buses on a 32-seater Licensed. 'Bus.
United Kingdom
.. 104.0 30,000 122.0 France .. .. 11.2 26,000 - 11.9 Germany .. .. 30.6 6,000 42.7 Italy .. 11.0 3,300 8.6 Belgium .. 16.0 1,000 16.9 California .. 19.3 4,826 4}% of receipts Illinois .. 20.6 2,588 28.2 Michigan • • 35.8 3,187 32.1 New York .. 8.2 4,565 14.7 Ohio .. .. 33.9 5,124 59.7 Pennsylvania • • 32.9 3,995 31.3 Texas .. .. 79.5 1,590 48.8
It will be of interest to give the number of persons per motor vehicle for the principal motor using countries, and here are the totals for 1927 together with those of the previous year for comparison. Motor cycles are not included, and the South African figure refers to White population only. - •
Persons per motor vehicle.
-
1927. • 1926.
U.S.A. .. 5.1 5.4 New Zealand .. 9-.1 10.9 Canada - 10.1
. 11.-5 -
' Australia • .. 13.8 16.6 United Kingdom 36.5 41.9 France .. 41.8 49.4
South Africa ..
157 180 Germany .. 162.4 212.0 Italy .. .. 274.7 304.0
Here are the figures relating severally to private cars and lorries.
•
NO. of persons per private car.
CouigTay. 1927. - " 1926.
United States .. 5.8 7.0 New Zealand* .. 11.0 13.3
-::Canada
• 1E5 W
Commix. 1027.
No. of persons per private car.
1926.
South Africa* .. 17-.1 21.4
Australia* .. 17.5 19.7 Great Britain .. 55 . 9. 83.9 France - • . 00.8 69.1 Germany . . 239.2 313.0 Italy .. • .. 353.3 495.8 No. of persbns per lorry.
COUNTRY. 1927. 1926.
42.3 United States ... 38.2 61.9 New Zealand* .. 56.9 100.6 Au.stralia* .. 67.9 - 97.8 Canada .. 84 . 4 128.1 France .. 128.3 169.0 Great Britain. .. 155.0 275.8 South Africa .. 187.9 700.0 Germany .. 505.6 794.0 Italy .. .. 756.8 * White population only.
The consistent reduction in the price of the products of the British Motor Industry has been a fact during the last few years which must have been distinctly disturbing to those who object to safeguarding either on principle or for reasons less -honest and connected with the importation of foreign goods. In addition _to. lowered prices it should. be .remembered that design and construction have been greatly advanced while the modern motor- vehicle is scarcely compatible with its equiv- alent of a few years back, and not only in performance but in equipment also. Thus better machines • at lower prices are now offered, and no one can with justification say that the British motor manufacturer has sheltered himself behind a tariff and exploited his public. The recoyery in our motoring industry as a whole has been due almost entirely to a reasonable measure of safeguarding, and it speaks • eloquently for the efficiency of this trade that such good recuperative power should be shown when other countries apparently needed a tariff barrier sufficient to all intents and purposes to keep out foreign production. An illustration of the fairness which has made the general foundation of the British industry so trust- worthy may be seen from the fact that at the Annual Olympia Motor Exhibition, unlike any other motor show in the world, 50 per cent. or even a predominating percentage of the stands are given to a ' display of -imported -ears. Real progress undoubtedly lies in open-mindedness. In the following table index figures of the fluctuations in list prices of twelve typical models each of private cars and commercial vehicles are compared with the cost of living index. In two further columns the private car and commercial vehicle index figures are corrected by the application of the cost of living index. On a gold basis current prices of private cars and commercial vehicles are 50.1 and 88 per cent. respectively below the pre-war level. The first six months of 1928 are included.
Index, of Nominal prices. Index of Gold Prices. Private Car Commercial Index Commercial
prices. Vehicle of-Cost Private Car Vehicle
Prices. of Living. Prices. Prices.
(1) (2)
1914 .. 100 100 . 100 100 100 1922 .. 135.5 126.2 181.4 74.8 69.7 1923 .. 116.5 117.7 173.6 67.1 67.8 1924 .. 99.1' 108.9 175.0 56.6 62.2 1925 .. 98.2 107.6 175.1 56.1 61.4 1926 .. 92.2 104.2 172.0 53.6 60.6 1927 .. 88.4 104.2 167.0 53.0 62.4 1928 .. 82.1 102.0 164.4 49.9 62.0
The industrial dislocation of 1926 increased the cost of production and especially that of materials, and a comparison of the first and second columns of the table above with the fluctuation of wholesale prices of materials and the earnings of work-people in the motor industry is a tribute to the increased efficiency of this trade.
Index of Wholesale Prices of Materials.
1914 100 1922 .. 155 1923 161 1924 166 1925 . 155 1926 • 144 1927 . 135 1928 . 135 Index of Earnings in Motor Industry.
100 176.4 185.3 192.2 187.6 197.9 183.5 YOUR MOTORING CORRESPONDENT,