
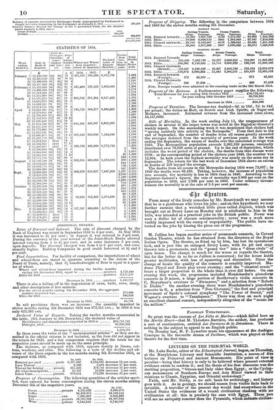


STATISTICS OF 1854.
Week ending Saturday. Gold in Bank of England. Price of Three per Cent Con. soli- highest and low. est.. Price of wheat weekly aye- rage. Wheat and Wheat Sour imported : stated in Quarters. Declared value of Exports (Monthly.) Peaths from
Cho-
lera in Metro- polls. Total Deaths in Metro- polls.
E
a. a.
1854. 1853. E
January 7 15,148,800 921 931 76 2 411,067 301,338 6,572,791
1,444 14 15.383,840 921 93 76 10
1,492 21 15.406,690
91.4 933
82 4
1,195 28 15,517,025
83 3
1,178 ■ February 4 15,523,620 913 91 90 91
537,489 528,222 5,863,093
1,204 11 15.466,910 1 92 82 4
1,178 18 15,513,220 91' 92 80 1
1,154 25 15,515,460
4 1 91 78 5
1,334 March 4 15,157,670 13 91 78 3 395,762 211,264 6,617,433
1,135 11 14,611,070 901 91 79 6
1,343 18 14,062,515 91 91 79 :
1,188 25 13,874,310 8.83 90 78 4
1,200 April 1 13,682,495 851 87 75 0 738,720 504,277 8,880,805
1,489 6
18,879,603
86 87 73 5
1,149 15 12,769,480 871 88 78 $
1,087 22 12,562,010 879 88 79 11
1,198 29 12,198,460 871 873 79 5
1,211 May 6 11,874,730 873 88 79 5 614,101 496,347 6,831,383
1,263 13 11,857,270
87 883
78 9
1,093 20 11,779,095
88 89
78 2
1,188 27 12,012,250 .8 893 78 9
1,143 June 3 12,006,875
93 92
79 11 661,643 612,936 7,532,648
1,090 10 11,981,750 92 933 73 9
1,110 17 12,373,2.55 shut 78 3
1,085 24 13,132,635 shut 77 11
1,183 July 1 13,483.985 shut 77 8 420,533 436,860 6,772,733
1,290 8 13,298,660 92 921 76 6
1 984 15 13,085,945 90 923 74 6
5 1,015 22 12,901,010 91 921 71 10
26 1,008 29 12,771,780
92 923-
69 8
133 1,219 August 5 12,593,700 92 921 64 8 352,510 800,093 8,372,191 399 1,456 12 12,833,350 92 931 62 3
644 1,832 19 13,002,755 93 94 64 0
729 1,833 26 12,943,695 93 943 63 7
847 2,039
-opt. 2
12.688,250 94 953 62 3 263,258 655,957 7,847,956 1,287 2,515 9 12,630,110 941 951 59 4
2,050 3,413 16 12,632,810
95 9s/
52 5
1,549 2,836 23 12,589,730
53 2
1,284 2,504 30 12,464,300 951 951 95 95 55 9
754 2,216 October 7 12,350,030 951 95 56 7 117,017 600,909 8,074,048 411 1,532 14 12,333,410
951 953
57 0
2-1d 1,394 21 12,818,125 94 95 57 6
163 1,321 28 13,022,310 943 941 60 7
66 1,228 v. 4 12,969,950
94; 943
68 0 83,823 512,266 5,574,868 31 1,252 11 12,999,380 934 941 72 1
23 1,160 18 12,852,420
72 11
12 1,309 25 13,102,620 91' 931 91 02 74 7
8 1,262 Dec. 2 13,244,460 91 92h 74 4 127,397 496,688 5,771,772 7
1,350
9 13,334,415 91 93/ 73 0
5 1,331 It 13,369,845 shut 72 3
2 1,300 23 13,478,185 shut 72 0
3 1,291 30 13,180,835 shut 73 9
1,508
ADDITIONAL DETAILS.
Bates of Discount and Interest. The rate of discount charged by the Bank of England was raised in September 18.53 to 5 per cent. In May 1854 it was increased to 51 per cent ; in August it was reduced to 5 per cent. During the currency of the year several of the Joint-Stock Banks allowed interest varying from 4 to 43 per cent, and in some instances 5 per cent, upon deposits. The discount charged was from 4 to 6 per cent, and occa- sionally higher. Railway Companies in good credit borrowed at 41 and 5 per cent.
Food Importations. For facility of comparison, the importations of wheat and wheat-flour are stated in quarters according to the datum of the Board of Trade, namely, that 31 hundredweight of flour is equal to a quar- ter of wheat.
Wheat and wheat-flour imported during the twelve months
ending 5th December 1854, equal to quarters 4,723,440
Ditto for 1853 quarters 6,157,157 Decrease in 1854 quarters 1,433,717
There is also a falling-off in the importation of oxen, bulls, cows, sheep, and other descriptions of live animals.
For the eleven months ending 5th December 1854, the aggregate number imported was 275,888 Ditto for 1853 344,626 Decrease in 1854 68,738
In salt provisions there was an increase : the quantity imported in eleven months ending 5th December 1854 was 973,311 cwt. ; in 1863 it was only 623,383 cwt.
Declared Value of Exports. Taking the twelve months enumerated in the table, (5th January to 5th December,) the declared value of
Merchandise and manufactures exported in 1854 is £84,711,721
Dittoifor„1853 85,930,292
Decrease in 1854 1,218,571
In these sums the value of the " unenumerated articles" as they are de- scribed in the official returns is not included, as the item did not appear in the return for 1853, and a fair comparison requires that the totals for the resTective years should be made up on the same principle.
The decrease, as compared with 1853, appears mainly in linens, cot- tons, woollens, and silks. The following is a note of the decline and ad- vance of the linen exports in the ten months ending 51,h November 1854, as compared with 1853.
In 1853. In 1834.
Entered per yard yards 3,597,990 3,134,025 decrease 13 per cent. Lace Thread 6,506 5,418 decrease 17 per cent. Thread for Sewing pounds 311,226 279,741 decrease 11 per cent.
All other descriptions A 15,537 15,928 increase 2 per cent.
Linen Tarn pounds 979,454 772,298 decrease 22 per cent.
Progress of Consumption. The following quantities of the articles speci- fied, were entered for home consumption during the eleven months ending December 5th of the respective years.
Cocoa • Coffee Sugar Tea Vine
In 1831. In 1853.
pounds 4,225,032 3,898,070 34,419,376 34,143,155 cwt. 7,496,486 6,824,892 pounds 56,765,922 50,507,834 gallons 6,645,816 6,746,007
Progress of Shipping. The following is the comparison between 1854 and 1853 for the eleven months ending 6th December.
TOS MON TRADE.
Sailing-Vessels. Steam-Vemele. Total.
Ships. Tonnage. Ships. Tonnage. Ships. Tonnage.
1851. Entered inwards,.. .26,285 5,991,739 .. 4523 1,374,507 .. 30,808 7,366,306 1853. Ditto 29,006 6,056,655 .. 3941 1,202,948 32,947 7,259,603 1854. Cleared outwards.. 29,705 8,132,007 .. 4176 1,26041 33.881 7,401,848 1853. Ditto 28,865 5,971,998 .. 3507 1,096,060 .• 32,372 7,068,058
01:1AMNO SRAM.
Sailing-VeseeLs. Steam-Vessels. Total.
Ships. Tonnage. Ships. Tonnage. Ships. Tonnage.
1854. Entered Inwards (British) 103,630 7,892,730 .. 16,357 3,909,955 ., 119,987 11,802,085 1853. Ditto 106,991 8,140,424 .. 15,755 1,668,029 122,746 11,808,446 1854. Cleared Outwards (British) 119,167 9,106,2198 16,387 3,803,780 135,534 12,910,678
1853. Ditto 119,976 8,980,363 .. 15,443 3,505,155 .. 135,419 12,485,518 1854. Entered Inwards
(Foreign)._ 372 43,325 ,„ 372 43,325 1854. Cleared !Outwards (Foreign) 293 37,659 .. 293 37,659
Note. Foreign vessels were admitted to the coasting trade onthe 23d March 1854.
Progress of the Emienue. A Parliamentary paper supplies the following,
Total Revenue for year ending 10th October 1854 £56,723,415
23 23 for year ending 10th October 1853 56,708,835
Increase in 1854 £16,580
Progress of Taxation. The Income-tax doubled-5d. to 10d., 7d. to 14d. per pound; the duties on Malt, on Scotch and Irish Spirits, on Sugar and Molasses increased. Estimated revenue from the increased rates alone 10,157,0001.
Lals of Mortality. In the week ending July 15, the reappearance of cholera in several of the larger towns was noted in the Registrar-General's weekly report. On the succeeding week it was mentioned that cholera had "sprung suddenly into activity in the Metropolis." From that date to the end, of September, the number of deaths from all causes greatly exceeded the averages deduced from the mortality of previous years. In the week ending 9th September, the excess of deaths over the calculated average was 2165. The Metropolitan population exceeds 2,362,236 persons, unequally distributed over 78,029 acres of ground. Up to the end of September, which includes the worst period of the cholera, the deaths from that disease were 9708: at the corresponding period of the cholera year 1849, the.number was 12,954. In both years the highest mortality was nearly onthe same day in September. The return for the last week of December 1851 shows an excess in deaths of 228 beyond the average.
The deaths from all causes in the Metropolis during 1854 were 73,697; in 1849 the deaths were 68,432. Taking, however, the increase of population into account, the mortality is less in 1854 than in 1849. According to the Registrar-General's figures, the rate of mortality was 3.908 per cent on the population in 1849, and 2.938 per cent in 1864. Under ordinary circum- stances the mortality is at the rate of 2.6 per cent per annum.